I’m a chart nerd, whether its pie graphs, line graphs, bar graphs, or spiral wedge charts.
Fast Tube by Casper
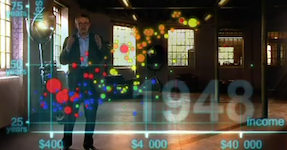
Hans Rosling, a world-renowned Swedish statistician, uses animated bubble charts to depict the growth, wealth, and health of world populations over the last two hundred years.
If you want to watch the entire documentary, you can download the torrent here. Its fascinating.