October 2011 Auto Sales Figures and Data
For once, it’s good to be Chrysler.
JESDA.COM | Cars, travel, etc.
Cars, travel, etc.
For once, it’s good to be Chrysler.
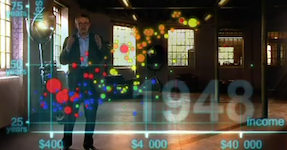
Hans Rosling, a world-renowned Swedish statistician, uses animated bubble charts to depict the growth, wealth, and health of world populations over the last two hundred years.
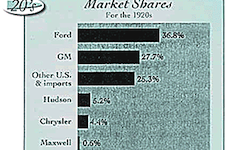
Bar graphs covering the 1920s through the 1990s including imports.