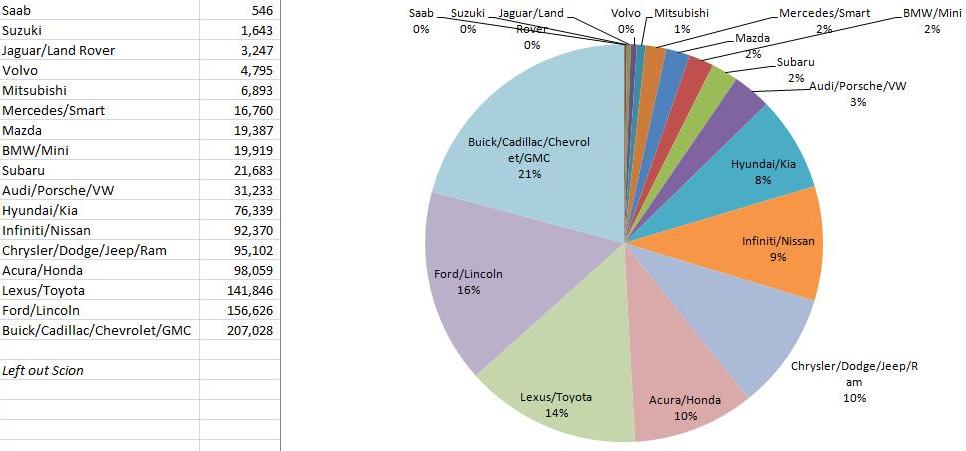
I love Excel, charts, and visual representations of data. “Amphibian” over at GM Inside News compiled February sales data and put together pie charts depicting market share for manufacturers and brands. Enjoy.
Click to enlarge.
Above: All US-market brands and manufacturers.

Above: All US-market luxury brands and manufacturers.